

I just stumbled upon an article written back in February 2023. In it, Martech Series reported that Rezolve.ai had integrated ChatGPT into its IT and HR service desk solutions. In a nutshell, end-users are able to interact with a specially-trained instance of ChatGPT from their own MS Teams interface.
The generative AI intelligently probes them for more information on their request or issue and responds appropriately. ChatGPT can then either direct the user to the solution or create a ticket for the support team with more actionable information.
This ChaptGPT integration has created a personalized support experience for employees and freed up help desk staff to focus on more pressing tasks. As a result, Rezolve claims to have “raised the bar” for service desk efficiency.
At ONEiO, this got us thinking about the future impact of large language models (LLMs) on the modern service desk, and how IT teams currently measure success across ticketing processes.
This blog is part 1 of a series looking at the metrics for measuring aspects of IT that affect IT ticketing processes and how strategic integrations can move the needle on those all-important Key Performance Indicators (KPIs).
Ticketing processes in IT services
Before diving into service desk KPIs, let’s take a quick look at what falls under the category of ticketing processes. For anyone outside of the IT team or service provider, the whole ticketing process might seem like somewhat of a black box. To those people, here’s what happens when you ask IT for something.
You want to access some new online tool, so you send a request to the IT department or supplier. This raises a ticket for the request, which is forwarded to the relevant team or individual. The IT personnel will begin investigating, asking you some questions about your request. Once they’ve gathered enough information, they’ll begin working to resolve the request and close the ticket. You might have an opportunity to give some feedback about your experience, and if you encounter an issue, the ticket can be reopened.
This describes the ticket lifecycle, which comprises the following phases:

The most common processes affecting ticketing
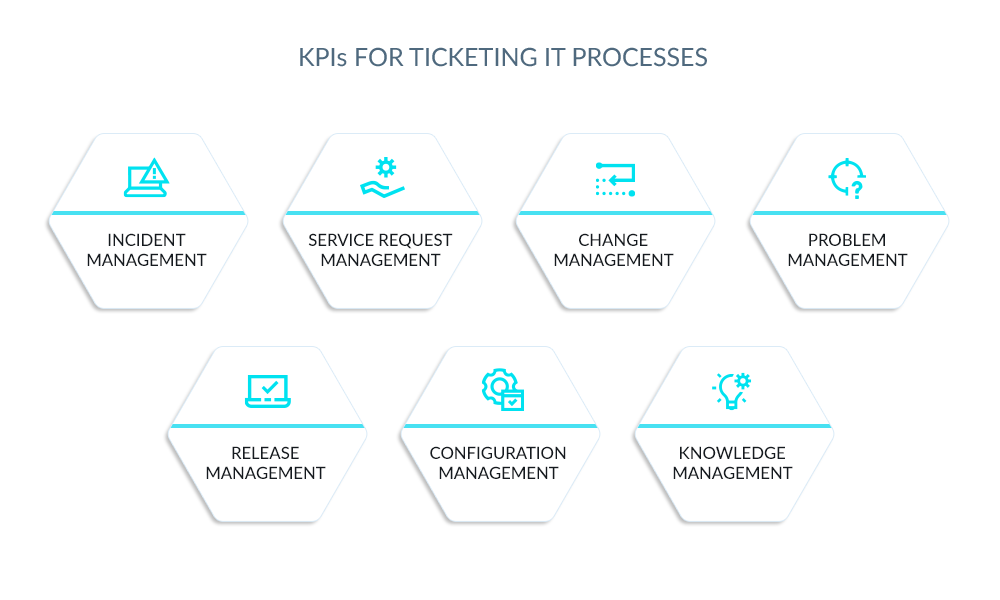
Before connecting each process to the appropriate metric, let’s quickly cover the areas we’re discussing. The below list is not exhaustive, but it covers the most important processes related to ticketing found across ITSM frameworks such as ITIL.
- Incident Management:
Incident Management is the process of restoring normal IT service operations as quickly as possible when incidents (unplanned disruptions or failures) occur. - Service Request Management:
Service Request Management deals with handling user requests for standard services, such as password resets, software installations, and hardware procurement.
- Change Management (AKA Change Control and Change Governance):
Change Management is the process of controlling and managing changes to the IT environment in a structured manner. In some frameworks, this process is also referred to as "Change Control" or "Change Governance." - Problem Management (AKA Error Control or Root Cause Analysis):
Problem Management aims to identify and eliminate the root causes of recurring incidents or to prevent potential incidents from occurring. - Release Management (AKA Deployment Management):
Release Management is the process of planning, scheduling, and controlling the movement of changes to the live IT environment. - Configuration Management (AKA Asset or Configuration Management):
Configuration Management involves maintaining accurate and up-to-date information about the IT infrastructure, including hardware, software, and their relationships. - Knowledge Management:
Knowledge Management is the process of capturing, storing, organizing, and sharing knowledge and information within an organization.
The importance of measuring and evaluating ticketing processes
Ultimately, improvement in any aspect of service delivery is about becoming better positioned to meet the needs of your customers. Getting there requires accurate measurement and evaluation, which in turn helps organizations implement efficient operations, maintain customer satisfaction, and drive continuous improvement.
Of course, between external IT suppliers and their customers, Service Level Agreements (SLAs) are commonly used as a means of laying out an agreed standard of service delivery; it isn’t standard practice to see SLAs being used within organizations. In larger organizations, especially those where the IT function is treated like an internal service provider, it's a good idea to adopt SLAs to keep teams on track to success.
SLAs define clear expectations for response times, resolution targets, and other critical metrics, setting the tone for the quality of services delivered. This is just as important within an organization as it is between an organization and its service providers.
SLAs can also help in measuring the efficiency of ITSM processes and highlighting weaknesses in your service delivery. Continual Service Improvement (CSI) is a central component of many ITSM frameworks, and SLAs provide a benchmark for service delivery KPIs. After all, how can you improve services if you’re not measuring their effectiveness properly?
By implementing a structured approach to measuring and evaluating ticketing processes, you establish a foundation for delivering consistent and exceptional IT services that align with user expectations and business objectives.
The best metrics for ticketing KPIs
Your KPI dashboard is like a health monitor for your business. With carefully selected KPI metrics, you can get a quick overview of your business’s vital signs to diagnose and treat problems effectively.
As a side note, just as KPI dashboards act like a health monitor for your business, an integrated monitoring and troubleshooting solution like LogicMonitor is a full-suite infrastructure monitoring solution that can provide full visibility over your IT service management ecosystem.

Knowing what makes a good KPI is step one; step two is deciding which metrics provide enough valuable insight into the health of your ticketing processes to be chosen as KPIs.
Choosing metrics as service desk KPIs
When choosing appropriate service desk KPIs or help desk KPIs, it’s helpful to look at relevant metrics as belonging to the following four categories:
Efficiency Metrics
In ticketing processes, efficiency metrics are of paramount importance. Being measures of productivity and effectiveness, they can clearly signal when and where something is going wrong in the ticket-handling process. Also, efficiency metrics are used to benchmark ongoing process improvement strategies and are especially useful in experimentation.
Quality Metrics
By assessing the accuracy and completeness of resolutions, quality metrics can indicate the effectiveness of your service desk. Improving the quality of your services helps foster strong client relationships and operational reliability. CSI initiatives focused on developing better-quality services will drive activities to improve these metrics.
Customer Experience Metrics (or Customer Service Metrics)
Improving the customer experience (CX) is really at the core of help desk or service desk improvement. Satisfied customers have the potential to become loyal customers, and loyal customers buy more, so there’s an obvious business case for improving customer experience metrics.
Cost Metrics
Cost metrics keep your ticketing processes financially efficient. Providing quality services in a cost-conscious way is one way to ensure that IT isn’t viewed as merely a cost center. Cost metrics are particularly important KPIs for managed services providers, where providing efficient client services is the core business.
Choosing the right mix of these metrics as your service desk KPIs is the first step to building a powerful engine for driving your ticketing processes toward excellence.

KPIs for IT processes affecting ticketing
OK, so we’ve covered what makes a good KPI and the general categories each metric will fall under — now it’s time to connect the metrics to the processes.
Below is a list of relevant KPIs for each ticketing process, with an explanation of what will actually be measured and how you go about measuring it. We’ve grouped these metrics together under the relevant process, but you may see them grouped under other categories. For example, in Incident Management, you’re likely to see tickets grouped by assignment group (who is responsible for the ticket) or by priority. Doing this makes it easier to pinpoint exactly where in the handling process you might improve.
Incident Management
- Resolution Time [Efficiency]:
Log the time taken to resolve incidents.
- Average Handling Time [Efficiency]:
Record the time agents spend on each incident.
- Escalation Rate [Efficiency]:
Document instances where incidents were escalated.
- Ticket Backlog [Efficiency]:
Monitor the number of pending incident tickets.
- Lost Productivity [Cost]:
Calculate your hourly operating costs and multiply by hours lost due to incidents.
- CX Metrics:
Measure the correlation between incidents and CX metrics.
Service Request Management
- Resolution Time [Efficiency]:
Measure the time taken to fulfill service requests.
- Self-Service Adoption Rate [Efficiency]:
Track the percentage of service requests handled through self-service channels.
- Cost per Ticket [Cost]:
Record the cost associated with each service request.
- Customer Effort Score (CES) [Customer Experience]:
Collect feedback on the ease of the service request process.
Change Management
- Change Lead Time [Efficiency]:
Record the time taken to implement changes.
- Change Success Rate [Quality]:
Track the percentage of successful change implementations.
- Cost per Resolution [Cost]:
Document the cost incurred for each change implementation.
- Error Rate [Quality]:
Measure the error rate associated with changes.
Problem Management
- MTBF (Mean Time Between Failures) [Efficiency]:
Track the time between recurring problems.
- MTTR (Mean Time to Repair) [Efficiency]:
Measure the time taken to resolve problems.
- Ticket Reopens [Quality]:
Monitor the number of reopened problem tickets.
- Knowledge Base Utilization [Quality]:
Analyze the frequency of knowledge base usage for problem resolution.
Release Management
- Change Lead Time [Efficiency]:
Measure the time taken to deploy releases.
- Change Success Rate [Quality]:
Track the success rate of release deployments.
- Service Availability [Efficiency]:
Monitor downtime during and after releases.
- Net Promoter Score (NPS) [Customer Experience]:
Collect customer feedback post-release to gauge satisfaction.
Configuration Management
- MTBF (Mean Time Between Failures) [Efficiency]:
Track the lifespan of configurations.
- Agent Utilization Rate [Cost]:
Monitor the efficiency of agent time allocation for configuration management.
- Cost Avoidance [Cost]:
Identify and mitigate potential costly issues in configurations.
- Quality Metrics [Quality]:
Measure the error rate associated with configuration changes.
Knowledge Management
- Knowledge Base Utilization [Efficiency]:
Measure the frequency of knowledge base usage.
- Agent Training Scores [Quality]:
Collect scores from agent training assessments.
- Ticket Reopens [Quality]:
Monitor reopened tickets due to insufficient knowledge.
- Customer Satisfaction Score (CSAT) [Customer Experience]:
Gauge customer satisfaction with the accuracy of the knowledge provided.
Tools and software for collecting ticketing process metrics
To effectively analyze ticketing process metrics, ITSM professionals can utilize a variety of tools and software solutions.
- ITSM Platforms:
Comprehensive ITSM platforms like ServiceNow, Jira Service Management, and BMC Helix provide built-in reporting and analytics features tailored to specific processes. - Business Intelligence Tools:
Tools like Tableau, Power BI, and QlikView enable the creation of customized dashboards for detailed analysis. - Statistical Analysis Tools:
Software such as Excel, R, and Python, equipped with data analysis libraries, facilitates advanced statistical evaluation. - Ticketing System Reports:
Many ticketing systems offer reporting modules that generate predefined reports for specific metrics. - Survey and Feedback Tools:
Tools like SurveyMonkey or Qualtrics help gather customer feedback for customer experience metrics.
With a flexible integration solution like ONEiO, analytics and monitoring tools can easily be integrated into your ITSM ecosystem — automating many manual tasks throughout your ticketing processes. To find out more, book a free 15-minute landscape assessment with one of our integration experts.
How to use data to improve your ticketing processes
Knowing the metrics to measure is one thing, but to put those KPIs into use and start benefiting from your new data obsession, you’ll need to know how to use those metrics.
In strategies for optimizing ticketing processes, we discuss how to use the metrics covered in this piece to improve operational efficiency and productivity throughout the ticket lifecycle. We also cover how end-to-end integration can help automate and optimize many of the steps you’ll take toward improving your ticketing processes.
Glossary of metrics in ticketing processes:
The following metrics measure efficiency in ticketing processes:
- Resolution Time:
The speed at which tickets are closed reflects your process efficiency. Faster resolutions mean happier customers and reduced operational strain.
- Average Handling Time:
This metric tracks the time agents spend on each ticket. Keeping this low ensures swift and effective support, maximizing agent productivity.
- Escalation Rate:
A higher escalation rate could indicate process bottlenecks or inadequate agent training, highlighting areas for improvement.
- Ticket Backlog:
A backlog indicates inefficiency and can lead to customer frustration. Monitoring and reducing this metric is crucial.
- Self-Service Adoption Rate:
Encouraging self-service reduces the load on agents, boosting efficiency and empowering customers.
- Mean Time Between Failures (MTBF):
This metric is vital for preventive maintenance, reducing downtime, and ensuring smooth operations.
- Mean Time to Repair (MTTR):
This measures how quickly your team can fix issues, minimizing service interruptions.
- Change Lead Time:
Efficiently managing changes reduces disruptions and keeps your processes running smoothly.
- Service Availability:
Downtime affects both efficiency and the customer experience. Keeping service availability high is crucial.
The following metrics measure quality in ticketing processes:
- Ticket Reopens:
Frequent ticket reopens signal unresolved issues, affecting customer satisfaction and workload.
- Error Rate:
Minimizing errors in ticket handling is key to providing high-quality support.
- Knowledge Base Utilization:
A well-utilized knowledge base indicates effective problem-solving, reducing ticket volume.
- Agent Training Scores:
Continuously training agents and tracking their performance ensures consistent quality.
- Change Success Rate:
Successful changes with minimal disruptions demonstrate process robustness.
The following metrics measure customer experience in ticketing processes:
- Net Promoter Score (NPS):
The NPS measures customer loyalty and their likelihood to recommend your service.
- Customer Effort Score (CES):
CES evaluates the ease of the customer's experience, aiming for minimal effort.
- First Contact Resolution Rate (FCR):
A high FCR signifies efficient and practical support.
- Customer Satisfaction Score (CSAT):
Directly measuring customer satisfaction helps you understand their experience.
- Customer Retention Rate:
Retaining customers is a testament to a positive overall experience.
The following metrics measure costs in ticketing processes:
- Cost per Ticket/Incident:
Tracking the cost associated with each ticket helps optimize resource allocation.
- Cost per Resolution:
Efficient resolutions directly impact your bottom line.
- Agent Utilization Rate:
Properly utilizing agent time ensures optimal staffing and cost control.
- Cost Avoidance:
Identifying and mitigating potential costly issues demonstrates proactive management.

